
Leaching: the C-S-H and a CEM I paste in renewed water
Before this page
A CEM I paste replaced by fly ash, carbonated, salted and leached, §5, for leach, and the CEM I 42.5 N of Validation against a measured paste.
Water that renews itself around a cement paste takes its calcium. Portlandite dissolves first, at the calcium concentration that saturates it; the C-S-H then loses calcium incongruently, its Ca/Si falling with the calcium of the solution; the AFm phases and ettringite dissolve on the way. This page computes both at equilibrium, in zero dimensions: the C-S-H alone, against the solubility data Berner (1992) compiled, and a paste leached by successive renewals of its solution, against the zones Adenot and Buil (1992) observed in a paste leached by deionized water. Nothing is fitted.
1. The C-S-H alone
Lime and amorphous silica in water, at a bulk Ca/Si from 0.5 to 3, with the C-S-H of Cemdata18 (Lothenbach et al., 2019) (CSHQ) and portlandite and amorphous silica beside it, at 25 °C:
using ChemistryLab, DynamicQuantities, Printf
include(joinpath(pkgdir(ChemistryLab), "scripts", "berner1992_leaching.jl"))

sweep = be92_sweep(vcat(0.5:0.05:2.0, 2.1:0.1:3.0))
println("bulk Ca/Si   gel Ca/Si   Ca (mmol/L)   Si (mmol/L)     pH   beside the gel")
for p in sweep[1:5:end]
    beside = p.portlandite ? "portlandite" : p.silica ? "amorphous silica" : ""
    @printf("%10.2f %11.3f %13.2f %13.4f %6.2f   %s\n", p.bulk, p.Ca_Si, p.Ca, p.Si, p.pH, beside)
end
println("all certified: ", all(p -> p.certified, sweep))
bulk Ca/Si gel Ca/Si Ca (mmol/L) Si (mmol/L) pH beside the gel
0.50 0.675 1.04 3.9284 9.79 amorphous silica
0.75 0.744 0.95 0.8910 10.96
1.00 0.963 2.17 0.3256 11.54
1.25 1.168 4.31 0.1725 11.86
1.50 1.338 8.23 0.0929 12.12
1.75 1.481 13.50 0.0529 12.32
2.00 1.611 19.50 0.0320 12.46
2.50 1.628 20.35 0.0300 12.48 portlandite
3.00 1.628 20.35 0.0300 12.48 portlandite
all certified: trueThe gel spans a Ca/Si from 0.68, where amorphous silica appears beside it, to 1.63, where portlandite does, at 20.3 mmol/L of calcium. Berner (1992), Appendix A gathers six sets of measurements on synthetic C-S-H, the Ca/Si of the solid against the calcium and the silicon of the solution, from 17 to 30 °C. At the Ca/Si of each measured solid within the range of the gel, the computed concentration is interpolated and compared:
m = be92_measured()
ratio(field) = [
    log10(getproperty(m, field)[i] / be92_interpolate(sweep, field, m.Ca_Si[i]))
        for i in eachindex(m.Ca_Si)
        if !ismissing(m.Ca_Si[i]) && !ismissing(getproperty(m, field)[i]) &&
            !isnan(be92_interpolate(sweep, field, m.Ca_Si[i]))
]
med(x) = sort(x)[cld(length(x), 2)]
for field in (:Ca, :Si)
    r = ratio(field)
    @printf("%-2s: %3d points, measured / computed at the median %.2f, within a factor 2 at %d\n",
            field, length(r), 10^med(r), count(abs.(r) .< log10(2)))
end
Ca: 176 points, measured / computed at the median 1.23, within a factor 2 at 164
Si: 101 points, measured / computed at the median 0.44, within a factor 2 at 34The calcium is reproduced: 164 of the 176 points lie within a factor of 2 of the computed curve, the measurements 1.23 times higher at the median, within the scatter of the six sets, which differ from one another by a factor of 2 to 3 at a given Ca/Si. The silicon is not: CSHQ dissolves 2.3 times more silicon than was measured at the median, and only 34 of the 101 points lie within a factor of 2. The same model overestimates the silicon of the C-S-H syntheses in alkali hydroxide (Alkali uptake by C-A-S-H).
using Plots
default(framestyle = :box, grid = false)
gel = [p for p in sweep if !p.portlandite && !p.silica]
measured(field) = [(m.Ca_Si[i], getproperty(m, field)[i]) for i in eachindex(m.Ca_Si)
                   if !ismissing(m.Ca_Si[i]) && !ismissing(getproperty(m, field)[i])]
f1 = plot(; xlabel = "Ca/Si of the solid", ylabel = "Ca (mmol/L)", yscale = :log10, legend = :bottomright)
scatter!(f1, first.(measured(:Ca)), last.(measured(:Ca)); ms = 2, label = "Berner (1992)")
plot!(f1, [p.Ca_Si for p in gel], [p.Ca for p in gel]; lw = 2, label = "CSHQ")
f2 = plot(; xlabel = "Ca/Si of the solid", ylabel = "Si (mmol/L)", yscale = :log10, legend = :topright)
scatter!(f2, first.(measured(:Si)), last.(measured(:Si)); ms = 2, label = "Berner (1992)")
plot!(f2, [p.Ca_Si for p in gel], [p.Si for p in gel]; lw = 2, label = "CSHQ")
savefig(plot(f1, f2; layout = (1, 2), size = (900, 380), left_margin = 5Plots.mm, bottom_margin = 5Plots.mm),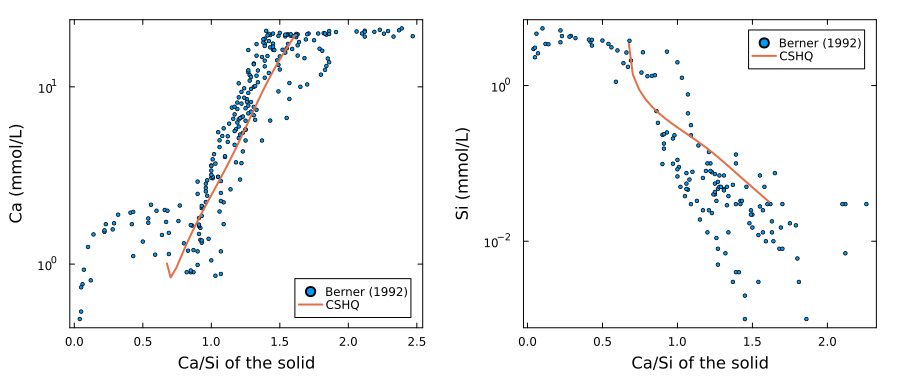
2. A paste in renewed water
The CEM I 42.5 N of Lothenbach and Winnefeld (2006) at 28 days, its solution removed and replaced by pure water forty times by 500 g per 100 g of cement, then forty times by 5000 g:
rows = be92_leaching()
println("certified: ", count(r -> r.certified, rows), " of ", length(rows))
println("   water (g/100 g)   Ca (mmol/L)    pH   portlandite   AFm   ettringite   C-S-H   Ca/Si")
for r in rows[[1, 3, 31, 33, 41, 44, 47, 54, 61, 81]]
    @printf("%17.0f %13.2f %6.2f %12.2f %6.2f %11.2f %8.1f %7.3f\n",
            r.water, r.Ca, r.pH, r.portlandite, r.afm, r.ettringite, r.csh, r.Ca_Si)
end
certified: 81 of 81
water (g/100 g) Ca (mmol/L) pH portlandite AFm ettringite C-S-H Ca/Si
0 0.96 13.62 23.16 6.70 17.29 46.9 1.591
1000 20.16 12.67 21.28 6.70 17.28 46.8 1.629
15000 19.76 12.64 0.00 6.73 17.17 46.2 1.607
16000 16.16 12.56 0.00 6.73 17.16 44.8 1.533
20000 8.53 12.31 0.00 6.71 17.12 41.2 1.340
35000 3.90 11.96 0.00 0.00 16.74 35.0 1.124
50000 2.64 11.72 0.00 0.00 15.06 31.7 0.975
85000 2.37 11.43 0.00 0.00 3.93 26.8 0.850
120000 1.07 11.18 0.00 0.00 0.00 22.6 0.755
220000 0.84 10.80 0.00 0.00 0.00 12.8 0.705The masses are in g per 100 g of cement. The alkalis leave with the first renewals, and the pH falls from 13.6 to 12.7. Portlandite then holds the calcium at 21 mmol/L and the gel at its Ca/Si of 1.63 until it is gone; only then does the C-S-H lose calcium, and the AFm phases and ettringite dissolve in turn:
println("gone           water (g/100 g)   Ca (mmol/L)    pH   gel Ca/Si")
for e in be92_events(rows)
    @printf("%-12s %17.0f %13.2f %6.2f %11.3f\n", e.phase, e.water, e.Ca, e.pH, e.Ca_Si)
end
gone water (g/100 g) Ca (mmol/L) pH gel Ca/Si
portlandite 15000 19.76 12.64 1.607
AFm 30000 5.10 12.09 1.204
ettringite 95000 2.12 11.40 0.835The order is the zoning of Adenot and Buil (1992), read from the core of their leached paste to its surface: the portlandite front, then the front of the monosulfoaluminate, here the AFm of a cement that also holds calcite, then the ettringite front. The water each step takes is not theirs: a renewed solution removes every solute at once, where their paste lost its ions by diffusion, faster the more mobile the ion, and the comparison is the sequence and the Ca/Si of the gel against the calcium of the solution, not the position of the fronts.
f3 = plot(; xlabel = "water passed (g per 100 g of cement)", ylabel = "g per 100 g of cement",
          xscale = :log10, legend = :topright, size = (700, 400))
w = [max(r.water, 100.0) for r in rows]
for (field, lab) in ((:portlandite, "portlandite"), (:afm, "AFm"), (:ettringite, "ettringite"), (:csh, "C-S-H"))
    plot!(f3, w, [getproperty(r, field) for r in rows]; lw = 2, label = lab)
end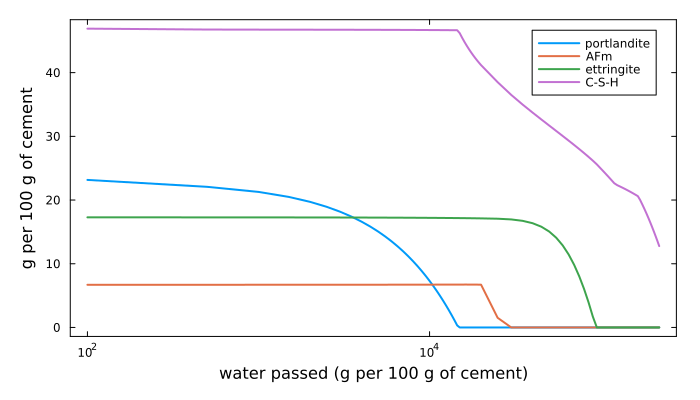
Where to go next
Sulfate attack and thaumasite follows what the water brings into the paste instead of what it takes.