
Seawater: a CEM I 42.5 R with limestone, titrated by the sea
Before this page
Sulfate attack and thaumasite, for a paste and a solution of one salt.
Seawater brings chloride, sulfate and magnesium at once. De Weerdt et al. (2014) cored a concrete of CEM I 42.5 R with limestone filler after sixteen years in the sea, measured its phases and elements against the depth, and computed with GEMS (Kulik et al., 2013) the paste in contact with increasing volumes of seawater, the volume standing for the depth: the core has seen little, the surface a great deal. This page repeats their calculation with Cemdata18 (Lothenbach et al., 2019), on their paste: 89 g of CEM I, 70 % of it reacted, 11 g of limestone and 42 g of water. The chloride AFm phases, thaumasite, brucite, hydrotalcite and M-S-H are allowed to form. Nothing is fitted.
The seawater of De Weerdt et al. (2014), Table 1, as tabulated, carries more anion than cation equivalents:
using ChemistryLab, DynamicQuantities, Printf
include(joinpath(pkgdir(ChemistryLab), "scripts", "seawater.jl"))

g = sw_charge_gap()
@printf("cations %.3f eq/L, anions %.3f eq/L; sodium %.3f mol/L printed, %.3f to close the charge\n",
        g.cations, g.anions, g.Na_printed, g.Na_closed)
cations 0.619 eq/L, anions 0.659 eq/L; sodium 0.478 mol/L printed, 0.518 to close the chargeThe charge is closed on sodium, whose printed ratio to chloride is lower than that of ordinary seawater; De Weerdt et al. (2014) do not give the temperature of their calculation, and this one is at 20 °C.
volumes = 10.0 .^ range(0, 4; length = 41)                  # mL per 100 g of cement
rows = sw_titration(volumes)
println("certified: ", count(r -> r.certified, rows), " of ", length(rows))
tr = sw_transitions(rows)
theirs = literature_table("DeWeerdt2014", "gems_seawater_transitions")
their(phase, event) = (i = only(k for k in eachindex(theirs.phase) if theirs.phase[k] == phase && theirs.event[k] == event);
                       @sprintf("%.0f-%.0f", ustrip(theirs.seawater_low[i]), ustrip(theirs.seawater_high[i])))
println("                         here (mL)   De Weerdt et al. (mL)")
for (lab, p, ev, phase, event) in (
        ("Friedel's salt appears", :friedel, :first, "Friedel's salt", "first"),
        ("monocarbonate is gone", :monocarbonate, :last, "monocarbonate", "last"),
        ("Friedel's salt is gone", :friedel, :last, "Friedel's salt", "last"),
        ("thaumasite appears", :thaumasite, :first, "thaumasite", "first"),
        ("brucite appears", :brucite, :first, "brucite", "first"),
        ("portlandite is gone", :portlandite, :last, "portlandite", "last"),
        ("calcite is gone", :calcite, :last, "calcite", "last"),
    )
    @printf("%-24s %10.0f   %s\n", lab, getproperty(tr[p], ev), their(phase, event))
end
certified: 41 of 41
here (mL) De Weerdt et al. (mL)
Friedel's salt appears 32 0-0
monocarbonate is gone 100 0-0
Friedel's salt is gone 501 0-0
thaumasite appears 631 0-0
brucite appears 1585 0-0
portlandite is gone 3981 0-0
calcite is gone 2512 0-0The volumes are mL of seawater per 100 g of cement, read on a grid of ten points per decade here and on (De Weerdt et al., 2014; Fig. 20) there. The order of the two calculations is the same: Friedel's salt from a few tens of mL, the monocarbonate giving it its aluminum; Friedel's salt gone where thaumasite appears, the carbonate and the sulfate taking the calcium and the aluminum from it; brucite, then portlandite gone; the calcite consumed by thaumasite. Cemdata18 moves the middle of the sequence to smaller volumes, the chloride AFm and the monocarbonate giving way four to sixteen times sooner, and brings the brucite later: the hydrotalcite it allows, which the restricted set of the authors did not, takes the magnesium first.
using Plots
default(framestyle = :box, grid = false)
fig = plot(; xlabel = "seawater (mL per 100 g of cement)", ylabel = "g per 100 g of cement", xscale = :log10,
           legend = :topleft, size = (750, 430))
for (p, lab) in ((:portlandite, "portlandite"), (:monocarbonate, "monocarbonate"), (:friedel, "Friedel's salt"),
                 (:ettringite, "ettringite"), (:thaumasite, "thaumasite"), (:brucite, "brucite"),
                 (:hydrotalcite, "hydrotalcite"), (:calcite, "calcite"))
    plot!(fig, volumes, [getproperty(r, p) for r in rows]; lw = 2, label = lab)
end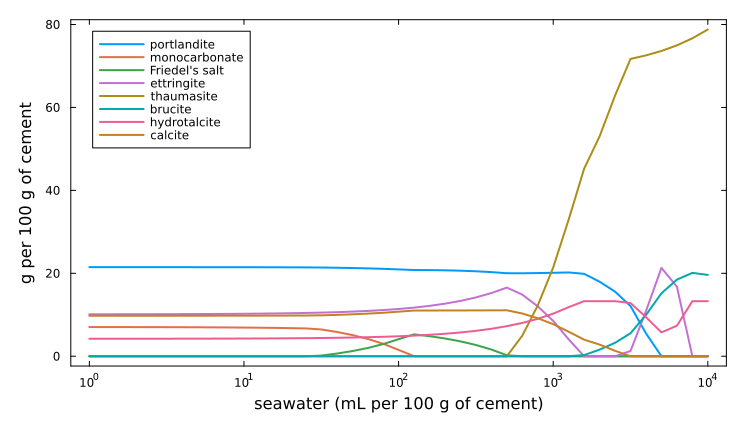
The core of their concrete, read from the surface inward, shows the same sequence the other way round: a layer rich in magnesium, brucite, at the surface; ettringite and thaumasite without portlandite over the first two millimeters; chloride at its highest a few millimeters in; chloride AFm deeper, to about 70 mm. Where the measurement and both calculations part is the chloride AFm itself: they found Kuzel's salt by EDS and no Friedel's salt by XRD, where both calculations form Friedel's salt and no Kuzel's salt. Seawater also carbonates the surface, which no titration by seawater represents.