
Validation on early pore solutions: a CEM I 52.5 R and its blends in their first six hours
Before this page
Activity models, and What the choice of activity model costs.
Schöler et al. (2017) extracted the pore solution of a CEM I 52.5 R, alone and with half of it replaced by slag, fly ash, limestone or quartz, six times during the first six hours of hydration. They analyzed the solutions (their Table 6) and computed from them how saturated each solution was with ettringite, portlandite, gypsum, monosulfate and a calcium-rich C-S-H (their Table 7), with GEMS (Kulik et al., 2013) and the Cemdata07 database (Lothenbach et al., 2008). For these solids the solubility products of Cemdata07 are those of Cemdata18 (Lothenbach et al., 2019).
This page computes the same indices from the same analyses. Nothing is equilibrated with a solid: each solution is only speciated, at the pH that was measured. What is compared is therefore the aqueous model, the species and the activity coefficients, which decide every other calculation of a pore solution.
The eight pastes are:
| paste | binder (wt. %) |
|---|---|
| C | cement |
| C-S, C-S-$ | 50 cement, 50 slag ($: sulfate adjusted) |
| C-FA, C-FA-$ | 50 cement, 50 fly ash |
| C-FA-L | 50 cement, 30 fly ash, 20 limestone |
| C-L | 50 cement, 50 limestone |
| C-Q | 50 cement, 50 quartz |
using ChemistryLab
using DynamicQuantities
using OptimaSolver
using Printf
using Plots
default(framestyle = :box, grid = false)
include(joinpath(pkgdir(ChemistryLab), "scripts", "scholer_2017.jl"))

systems = s17_systems()
# The activity model Cemdata18 prescribes, for KOH solutions: potassium is the
# main cation of every solution of Table 6. The paper does not state its own.
model = cemdata18_activity_model(:KOH)
1. Each analysis, speciated at its pH
The analysis gives the total calcium, aluminum, sulfate, potassium, sodium and silicon in mmol per liter, taken here as mmol per kilogram of water, and the pH. The elements are fixed; hydroxide is added or taken until the pH is the one measured, so the charge that an analysis leaves unbalanced (a few percent) goes to it.
# `Any`: the type of a state is long enough that a dictionary specialized on it
# takes minutes to compile.
runs = Dict{Any, Any}((s, a) => s17_solution(systems.aqueous, s, a; model) for s in s17_systems_listed(), a in s17_ages())
@printf("%d solutions, certified: %d\n", length(runs), count(r -> r.certificate.optimal, values(runs)))
48 solutions, certified: 482. The saturation indices, against the paper's
labels = ["E", "CH", "Gp", "Ms", "CSH"]
ours = Dict(k => s17_indices(r.state, systems; model) for (k, r) in runs)
println("index   solutions   mean difference   largest difference")
for l in labels
    d = [ours[k][l] - s17_published(k..., l) for k in keys(runs) if s17_published(k..., l) !== nothing]
    @printf("%-6s  %9d   %15.2f   %18.2f\n", l, length(d), sum(d) / length(d), maximum(abs, d))
end
index solutions mean difference largest difference
E 48 -0.41 0.89
CH 48 -0.06 0.07
Gp 48 -0.07 0.08
Ms 48 -0.27 0.73
CSH 47 0.17 0.21panels = map(labels) do l
ks = [k for k in keys(runs) if s17_published(k..., l) !== nothing]
x = [s17_published(k..., l) for k in ks]
y = [ours[k][l] for k in ks]
lo, hi = extrema(vcat(x, y))
p = plot([lo, hi], [lo, hi]; color = :gray, label = false, title = l,
xlabel = "Schöler et al.", ylabel = "this page")
scatter!(p, x, y; label = false, color = :steelblue, markersize = 3)
p
end
fig = plot(panels...; layout = (1, 5), size = (1100, 260), left_margin = 6Plots.mm, bottom_margin = 8Plots.mm)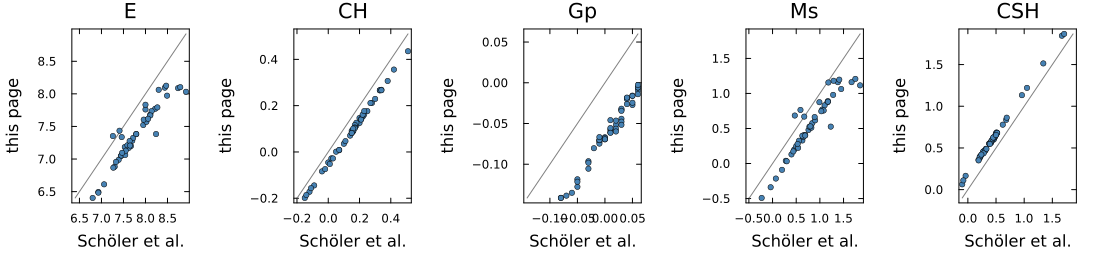
Every solution is speciated and certified. Portlandite and gypsum agree with Schöler et al. (2017) to within 0.08, and the calcium-rich C-S-H to within 0.21. Ettringite and monosulfate differ more, up to 0.9 and 0.7, and it is worth seeing where.
A difference in the activity of one ion enters an index as many times as the formula holds that ion. Ettringite holds six calcium, three sulfate and four hydroxide, monosulfate four calcium, one sulfate and four hydroxide, and both two aluminum. Their difference is therefore twice what gypsum measures, calcium and sulfate:
worst = maximum(k -> abs((ours[k]["E"] - s17_published(k..., "E")) - (ours[k]["Ms"] - s17_published(k..., "Ms")) -
                         2 * (ours[k]["Gp"] - s17_published(k..., "Gp"))), collect(keys(runs)))
@printf("largest departure from ΔE − ΔMs = 2 ΔGp over the 48 solutions: %.3f\n", worst)
largest departure from ΔE − ΔMs = 2 ΔGp over the 48 solutions: 0.022The two calculations therefore differ little on calcium, sulfate and hydroxide, by the same few hundredths of a log unit in every solution, and the part of ettringite and monosulfate that varies from one solution to the next is a factor on aluminum. It is largest in the sulfate-adjusted fly-ash blend (C-FA-$), where the aluminum is at 1.5 to 4.5 µmol/L, and reaches 0.28 log units there. At these pH both calculations hold the aluminum as Al(OH)₄⁻ (here AlO2-); leaving out the aluminosilicate complexes of Cemdata18, which Cemdata07 did not have, changes no index by more than 0.01. Schöler et al. (2017) do not say what else their calculation did with aluminum, and the difference is reported here as found.
Where to go next
Validation on pore solutions over 550 days does the same for a CEM I and its fly-ash blends over eighteen months. Validation against a measured paste follows a Portland paste through its first year, where the solids are equilibrated too.