
Sulfate attack and thaumasite: a CEM I in sodium sulfate
Before this page
Leaching: the C-S-H and a CEM I paste in renewed water, for a paste whose surroundings change it, and Recipes: materials, extents and what has not reacted.
A solution of sodium sulfate brings sulfate into a paste of Portland cement. The AFm phases take it up and become ettringite; at high concentration gypsum precipitates; with calcite, the C-S-H, portlandite and sulfate can form thaumasite, at low temperature above all. Two papers studied one laboratory CEM I: Lothenbach et al. (2010) exposed mortars to 4 and 44 g/L of Na₂SO₄ and measured the sulfur and calcium of the paste by SEM-EDS; Schmidt et al. (2008) equilibrated crushed pastes of the same cement, with 0, 5 and 25 % of limestone, with Na₂SO₄ solutions at 8 and 20 °C. This page computes both with Cemdata18 (Lothenbach et al., 2019), the cement fully hydrated as both papers' own calculations assume it. Nothing is fitted.
1. A paste titrated by the solution
The paste at w/c 0.5 and 20 °C, mixed with an increasing volume of solution, up to 100 L per 100 g of cement: the axis of the zero-dimensional model of Lothenbach et al. (2010), on which the unaffected core sits at the left and the surface, which has seen the most solution, at the right.
using ChemistryLab, DynamicQuantities, Printf
include(joinpath(pkgdir(ChemistryLab), "scripts", "sulfate_attack.jl"))

paste = sa_paste(; w_b = 0.5, T = 293.15)
M = ustrip(us"g/mol", Species("Na2SO4")[:M])
volumes = 10.0 .^ range(0, 5; length = 31)               # mL per 100 g of cement
low = sa_titration(paste, 4 / M, volumes)
high = sa_titration(paste, 44 / M, volumes)
println("certified: ", count(r -> r.certified, low) + count(r -> r.certified, high), " of ", 2 * length(volumes))
println("              AFm gone at   gypsum from   portlandite gone at   largest SO3/CaO")
for (lab, rows) in (("4 g/L", low), ("44 g/L", high))
    e = sa_events(rows)
    @printf("%-8s %13.0f %13s %21.0f %11.2f at %.0f mL\n", lab, e.afm_gone,
            isnan(e.gypsum) ? "never" : @sprintf("%.0f", e.gypsum), e.portlandite_gone, e.ratio_max, e.V_ratio_max)
end
certified: 62 of 62
AFm gone at gypsum from portlandite gone at largest SO3/CaO
4 g/L 1468 never 21544 0.27 at 46416 mL
44 g/L 147 2154 6813 0.57 at 14678 mLThe volumes are in mL per 100 g of cement. The AFm of sulfate turns into ettringite first; gypsum forms in 44 g/L of Na₂SO₄ and never in 4 g/L, as the SEM-EDS of Lothenbach et al. (2010) found it, only in the mortar exposed to 44 g/L. The SO₃/CaO of the solids, which the normalization of an EDS analysis does not change, rises from 0.045 in the paste to 0.27 in 4 g/L and 0.57 in 44 g/L. The measured profiles reach about 10 and 20 wt.% of SO₃ against 45 to 47 % of CaO, ratios of 0.22 and 0.44, after 9 months and 8 weeks of exposure, where the calculation is the end of the road.
using Plots
default(framestyle = :box, grid = false)
fig = plot(; layout = (1, 2), size = (900, 380), legend = :topleft, left_margin = 5Plots.mm, bottom_margin = 5Plots.mm)
for (k, (lab, rows)) in enumerate((("4 g/L", low), ("44 g/L", high)))
    for (field, name) in ((:ettringite, "ettringite"), (:gypsum, "gypsum"), (:portlandite, "portlandite"),
                          (:afm_so4, "AFm"), (:thaumasite, "thaumasite"))
        plot!(fig[k], volumes, [getproperty(r, field) for r in rows]; xscale = :log10, lw = 2, label = name,
              title = lab, xlabel = "solution (mL per 100 g of cement)", ylabel = "g per 100 g of cement")
    end
end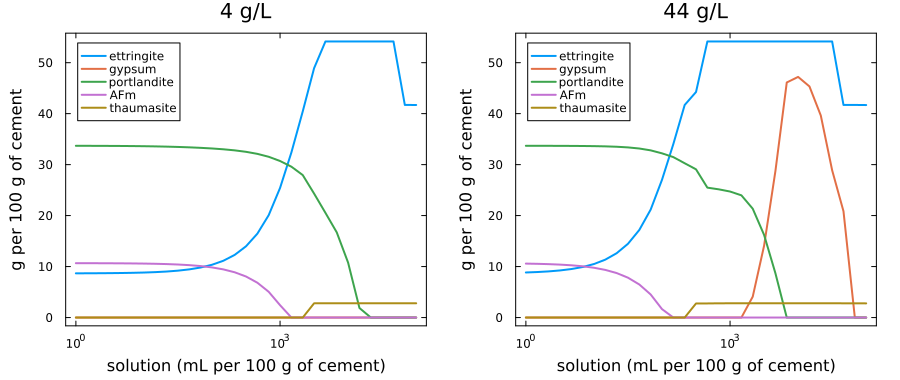
2. Thaumasite, at 8 and 20 °C
The batches of Schmidt et al. (2008): the binder with 0, 5 or 25 % of limestone (P0, P5, P25), fully hydrated, its solids mixed with seven times their mass of 0.30 mol/L (subsystem A) or 0.15 mol/L (B) of Na₂SO₄. At equilibrium the thaumasite takes what it can:
calc = literature_table("Schmidt2008", "thaumasite_calculated_maximum")
theirs(T, b, s) = only(ustrip(calc.thaumasite[i]) for i in eachindex(calc.binder)
                       if calc.temperature_C[i] == T && calc.binder[i] == b && calc.subsystem[i] == s)
println("batch    thaumasite (wt.% of the solids), here / Schmidt et al.")
println("            8 °C           20 °C")
batches = Dict()
for (b, ls) in (("P5", 0.05), ("P25", 0.25)), s in ("A", "B")
    r8, r20 = (sa_batch(; limestone = ls, level = s, T) for T in (281.15, 293.15))
    batches[(b, s)] = (r8, r20)
    @printf("%-4s %s   %5.1f / %3.0f   %5.1f / %3.0f\n", b, s, 100 * r8.thaumasite / r8.solids, theirs(8, b, s),
            100 * r20.thaumasite / r20.solids, theirs(20, b, s))
end
batch thaumasite (wt.% of the solids), here / Schmidt et al.
8 °C 20 °C
P5 A 20.3 / 26 20.3 / 25
P5 B 20.6 / 25 20.9 / 21
P25 A 67.1 / 68 60.6 / 59
P25 B 32.8 / 38 31.0 / 34Cemdata18 gives the thaumasite the calculation of Schmidt et al. (2008) gave it with the database of the time, within 6 % of the solids: more at 8 °C than at 20 °C where the C-S-H limits it (P25), the same at both where the calcite does (P5), every calcite gone. What Lothenbach et al. (2010), Schmidt et al. (2008) measured by ²⁹Si NMR after nine months is 0.3 to 2 wt.%, more at 8 °C: thaumasite forms slowly, and the equilibrium is where it goes, not where it is.
Without thaumasite, the batches stop at what was measured: a solution held by gypsum, monosulfate or monocarbonate, after nine months.
meas = literature_table("Schmidt2008", "solutions_9_months")
mval(T, b, s, col) = only(ustrip(getproperty(meas, col)[i]) for i in eachindex(meas.binder)
                          if meas.temperature_C[i] == T && meas.binder[i] == b && meas.subsystem[i] == s)
println("batch      S (mmol/L)       Ca (mmol/L)      Na (mmol/L)        pH")
for (b, ls) in (("P0", 0.0), ("P5", 0.05), ("P25", 0.25)), s in ("A", "B")
    r = sa_batch(; limestone = ls, level = s, T = 293.15, thaumasite = false)
    @printf("%-4s %s  %6.0f / %4.0f   %6.2f / %5.2f   %6.0f / %4.0f   %6.2f / %5.2f\n", b, s,
            r.S, mval(20, b, s, :S), r.Ca, mval(20, b, s, :Ca), r.Na, mval(20, b, s, :Na), r.pH, mval(20, b, s, :pH))
end
batch S (mmol/L) Ca (mmol/L) Na (mmol/L) pH
P0 A 203 / 79 4.70 / 4.57 592 / 435 13.31 / 13.00
P0 B 51 / 31 3.02 / 5.11 294 / 204 13.33 / 13.00
P5 A 207 / 78 5.11 / 4.32 591 / 426 13.29 / 13.00
P5 B 56 / 28 3.31 / 5.11 294 / 335 13.31 / 13.00
P25 A 221 / 56 6.86 / 3.91 589 / 344 13.23 / 13.00
P25 B 71 / 25 4.62 / 4.49 293 / 152 13.24 / 13.00Here / measured, at 20 °C. The calcium is within a factor of 2 and the pH 0.2 to 0.3 high; the sulfur is 1.6 to 3.9 times too high and, but for one batch, the sodium by a third to a factor of 2. At equilibrium the sulfate of these batches is taken by ettringite and the excess stays dissolved; in the experiments gypsum precipitated while monosulfate or monocarbonate persisted, an assemblage the equilibrium does not hold, and sodium left the solution, which the C-S-H of the calculation, with its sodium end member, does not take up.
Where to go next
Seawater brings sulfate, chloride and magnesium at once.