
Validation on pore solutions from 7 to 80 °C: a CEM I with quartz or fly ash
Before this page
Validation on pore solutions over 550 days, which does the same at 23 °C with the method used here.
Deschner et al. (2013) cured the pastes of Deschner et al. (2012) with half of the cement replaced by quartz powder or by a siliceous fly ash, sealed at 7, 23, 40, 50 and 80 °C, at a water-to-binder ratio of 0.5, and analyzed their pore solutions from one day to six or eight months (their Tables A.1 and A.2). From each solution they computed, at its curing temperature, the effective saturation indices of portlandite, ettringite, monosulfate and strätlingite (their Table B.1): log₁₀(IAP/K) divided by the number of ions the solid dissolves into.
This page computes the same indices from the same analyses, each solution speciated at its measured hydroxide and at the temperature it was cured at. Where the page at 23 °C tests the activity model and the solubility products at one temperature, this one tests their temperature dependence: the Debye–Hückel parameters A and B, which the model recomputes at each temperature, and the solubility products, which the database extrapolates from 25 °C through the heat capacities of the species.
| paste | binder (wt. %) |
|---|---|
| OPC-Qz | 50 cement, 50 quartz |
| OPC-FA | 50 cement, 50 siliceous fly ash |
Where the analyses come from
The tables print the concentrations in mmol per liter, read here as mmol per kilogram of water, and the free hydroxide Deschner et al. (2013) derived from the pH, measured with an electrode calibrated against KOH solutions (data/literature/Deschner2013.json). Iron and chloride are analyzed as well; they enter the solution and its ionic strength, and complex nothing the indices read. The analyses carry a standard deviation of 5 to 10 %.
using ChemistryLab
using DynamicQuantities
using OptimaSolver
using Printf
using Plots
default(framestyle = :box, grid = false)
include(joinpath(pkgdir(ChemistryLab), "scripts", "deschner_2013.jl"))

systems = d13_systems()
# The activity model Cemdata18 prescribes for KOH solutions, its A and B
# computed at the temperature of each solution.
model = cemdata18_activity_model(:KOH)
1. Each analysis, speciated at its hydroxide and its temperature
# `Any`: the type of a state is long enough that a dictionary specialized on it
# takes minutes to compile, where the 54 solutions take one.
runs = Dict{Any, Any}(k => d13_solution(systems.aqueous, k...; model) for k in d13_solutions())
@printf("%d solutions, certified: %d\n", length(runs), count(r -> r.certificate.optimal, values(runs)))
54 solutions, certified: 542. The effective saturation indices, against the paper's
labels = ["CH", "Ettr", "Ms", "Strätl"]
ours = Dict(k => d13_indices(r.state, systems, k[2]; model) for (k, r) in runs)
temperatures = sort(unique(k[2] for k in keys(runs)))
println("index    T (°C)   solutions   mean difference   largest difference")
for l in labels, T in temperatures
    ks = [k for k in keys(runs) if k[2] == T]
    d = [ours[k][l] - d13_published(k..., l) for k in ks]
    @printf("%-7s  %6.0f   %9d   %15.3f   %18.3f\n", l, T - 273.15, length(d), sum(d) / length(d), maximum(abs, d))
end
index T (°C) solutions mean difference largest difference
CH 7 12 0.025 0.055
CH 23 12 -0.017 0.080
CH 40 12 0.036 0.074
CH 50 12 0.030 0.080
CH 80 6 0.132 0.405
Ettr 7 12 0.005 0.018
Ettr 23 12 -0.002 0.013
Ettr 40 12 -0.002 0.034
Ettr 50 12 0.001 0.017
Ettr 80 6 0.042 0.150
Ms 7 12 0.019 0.037
Ms 23 12 -0.008 0.030
Ms 40 12 0.002 0.025
Ms 50 12 -0.005 0.026
Ms 80 6 0.047 0.171
Strätl 7 12 0.001 0.047
Strätl 23 12 -0.004 0.036
Strätl 40 12 -0.019 0.036
Strätl 50 12 -0.012 0.041
Strätl 80 6 0.015 0.227panels = map(labels) do l
p = plot([-0.6, 0.8], [-0.6, 0.8]; color = :gray, label = false, title = l,
xlabel = "Deschner et al.", ylabel = "this page")
for T in temperatures
ks = [k for k in keys(runs) if k[2] == T]
scatter!(p, [d13_published(k..., l) for k in ks], [ours[k][l] for k in ks];
label = l == "CH" ? @sprintf("%.0f °C", T - 273.15) : false, markersize = 3)
end
p
end
fig = plot(panels...; layout = (1, 4), size = (1100, 280), left_margin = 6Plots.mm, bottom_margin = 8Plots.mm)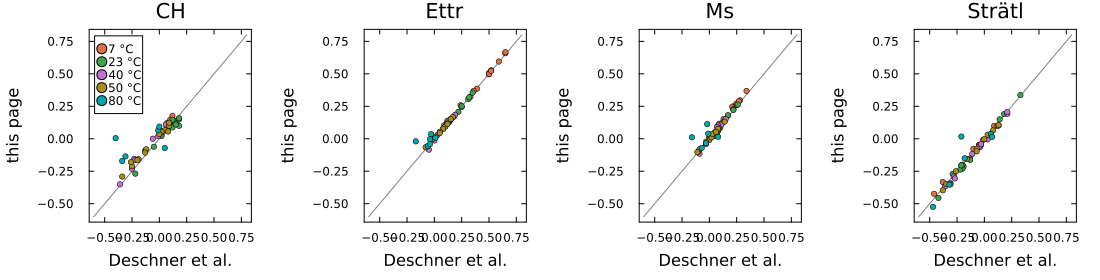
The six solutions at 80 °C, with their sulfur and their ionic strength:
println("80 °C   days   S (mol/L)   I (mol/kg)      CH this page / paper     Ettr             Ms               Strätl")
for k in sort([k for k in keys(runs) if k[2] > 350])
    @printf("%-7s %4.0f %10.3f %12.2f    ", k[1], k[3], d13_concentrations(k...)["S"], ionic_strength(runs[k].state))
    for l in labels
        @printf("  %+.2f / %+.2f   ", ours[k][l], d13_published(k..., l))
    end
    println()
end
80 °C days S (mol/L) I (mol/kg) CH this page / paper Ettr Ms Strätl
OPC-FA 1 0.155 0.50 +0.00 / -0.40 +0.04 / -0.03 +0.11 / -0.02 +0.01 / +0.07
OPC-FA 2 0.149 0.43 -0.17 / -0.34 -0.02 / -0.17 +0.01 / -0.16 +0.02 / -0.21
OPC-FA 7 0.167 0.48 -0.14 / -0.31 -0.00 / -0.04 +0.04 / -0.01 +0.04 / +0.06
OPC-Qz 1 0.072 0.29 -0.07 / +0.05 +0.01 / +0.01 +0.02 / +0.08 -0.15 / -0.18
OPC-Qz 2 0.062 0.29 +0.07 / -0.01 -0.06 / -0.06 -0.03 / -0.03 -0.35 / -0.32
OPC-Qz 7 0.084 0.32 +0.09 / +0.00 -0.04 / -0.04 -0.07 / -0.07 -0.52 / -0.47Every solution is speciated and certified. From 7 to 50 °C the four indices differ from those of Deschner et al. (2013) by 0.08 at most, and their mean difference at each temperature is within 0.04: the temperature dependence of the activity model and of the solubility products reproduces the one the authors computed with, over forty-three degrees and both pastes, as the 23 °C page does at one temperature.
At 80 °C the agreement holds for the three solutions of OPC-Qz, to 0.12, and not for the three of OPC-FA, whose portlandite index differs by up to 0.41 and the others by up to 0.23. These are the solutions richest in sulfate, twice those of OPC-Qz at the same temperature, at an ionic strength near 0.5 mol/kg against 0.3. Three things change together there and the comparison does not separate them: the third parameter of the activity model, b_γ, which the model keeps at its 25 °C value, the only one its sources give for KOH (cemdata18_activity_model); the complexes of sulfate with calcium and the alkalis, whose stability grows with temperature; and the database, Cemdata18 (Lothenbach et al., 2019) here, and for the authors the Nagra/PSI database with the cement data of Lothenbach et al. (2008) and of Dilnesa et al.
A test holds it
test/validation_deschner2013.jl speciates every solution of the table and pins each of the agreements this page states.
Where to go next
Validation on pore solutions over 550 days is the same comparison at 23 °C on five pastes, and Kinetics under partial equilibrium the coupling a heated cell needs, in which these temperature dependences enter the trajectory.